Using vibration analysis the experts at Vibration Analysts can detect faults in machinery long before catastrophic failure.
Utilizing vibration analysis and coupling it with predictive maintenance, all types of machinery, from Ferris wheels to nuclear power plants, can be better maintained for lower costs. But what does a vibration analysis report actually look like?
How does Vibration Analysts convey the data you need to better maintain your equipment?
We thought it would be helpful to show you an example of a vibration analysis report so you can see just how informative they can be.
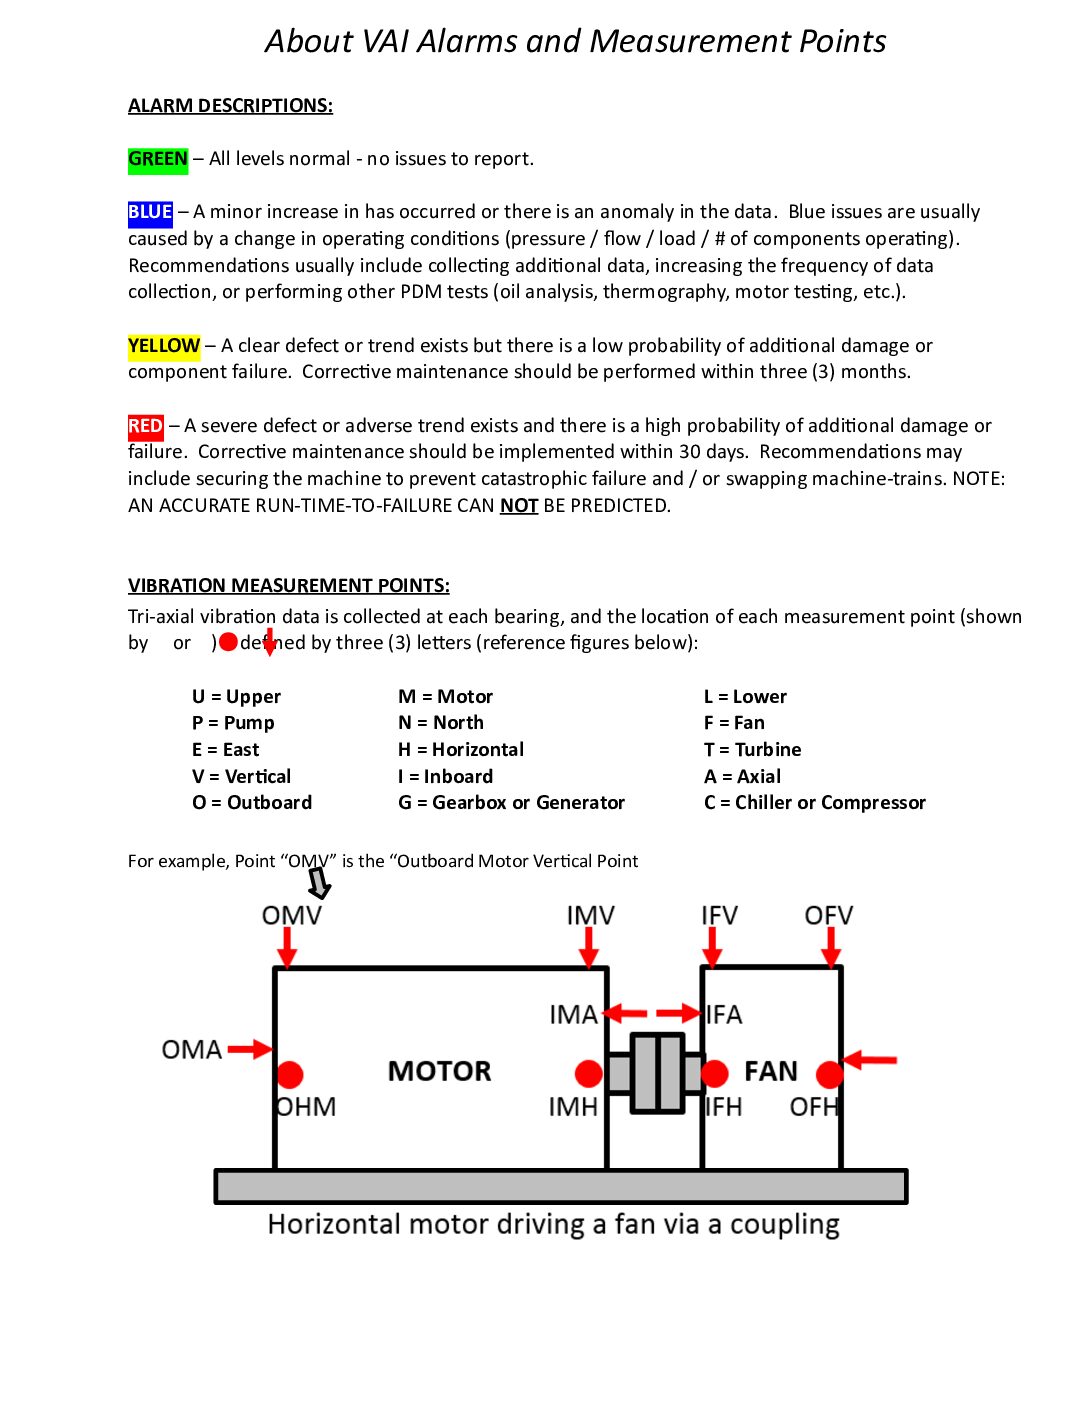
Vibration Analysis Reports Begin with Definitions
The first page of a vibration analysis report explains the various levels of repair alarms and provides descriptions of how serious they are. Components and machinery with red alarms are in need of immediate repair. Green means there are no faults to report. Blue means we’re keeping a close eye on the vibration analysis numbers for that component and yellow means it’s not a replace it right now situation but within 90 days, corrective action should take place.
We also show a diagram explaining the measurement points at which various vibration was recorded.
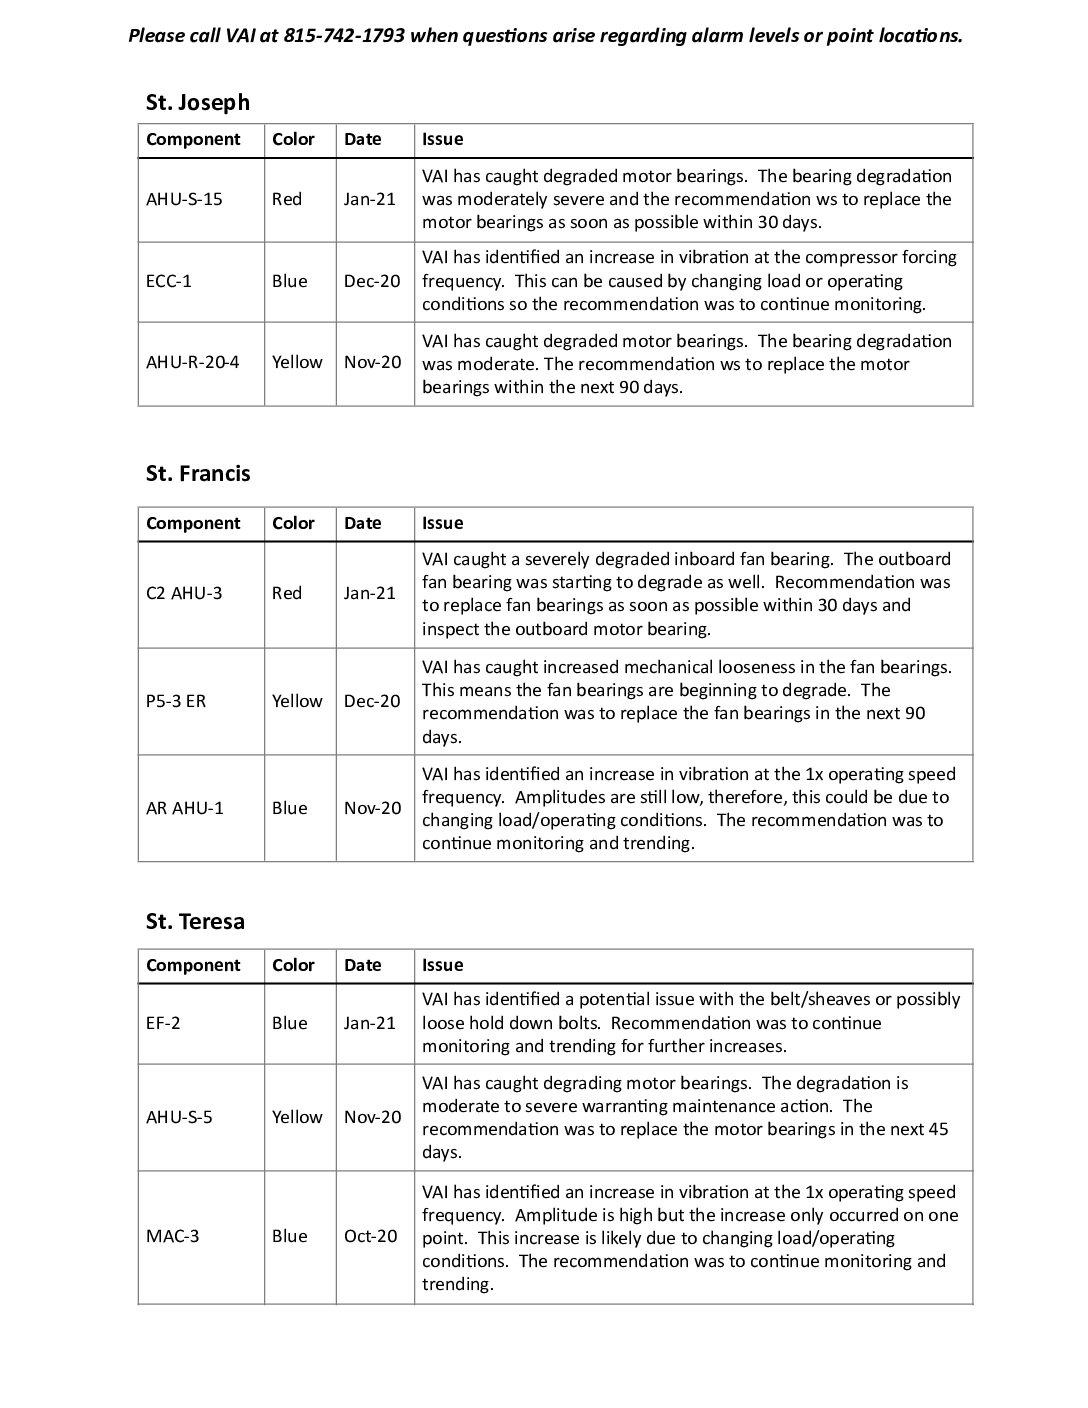
Vibration Analysis Report Summary Page
The second page of a vibration analysis report provides a summary of the comments measured and a brief description of any recommendations made.
This is the overall view of the vibration analysis done at the site or sites being monitored.
This data can be used to create an action plan or a to-do list of components that need to be replaced. It provides a framework upon which you can build a list of priorities and schedule out maintenance.
It also list components that are in a blue status and under further observation. So you can have a good idea of what may be coming in the neat future.
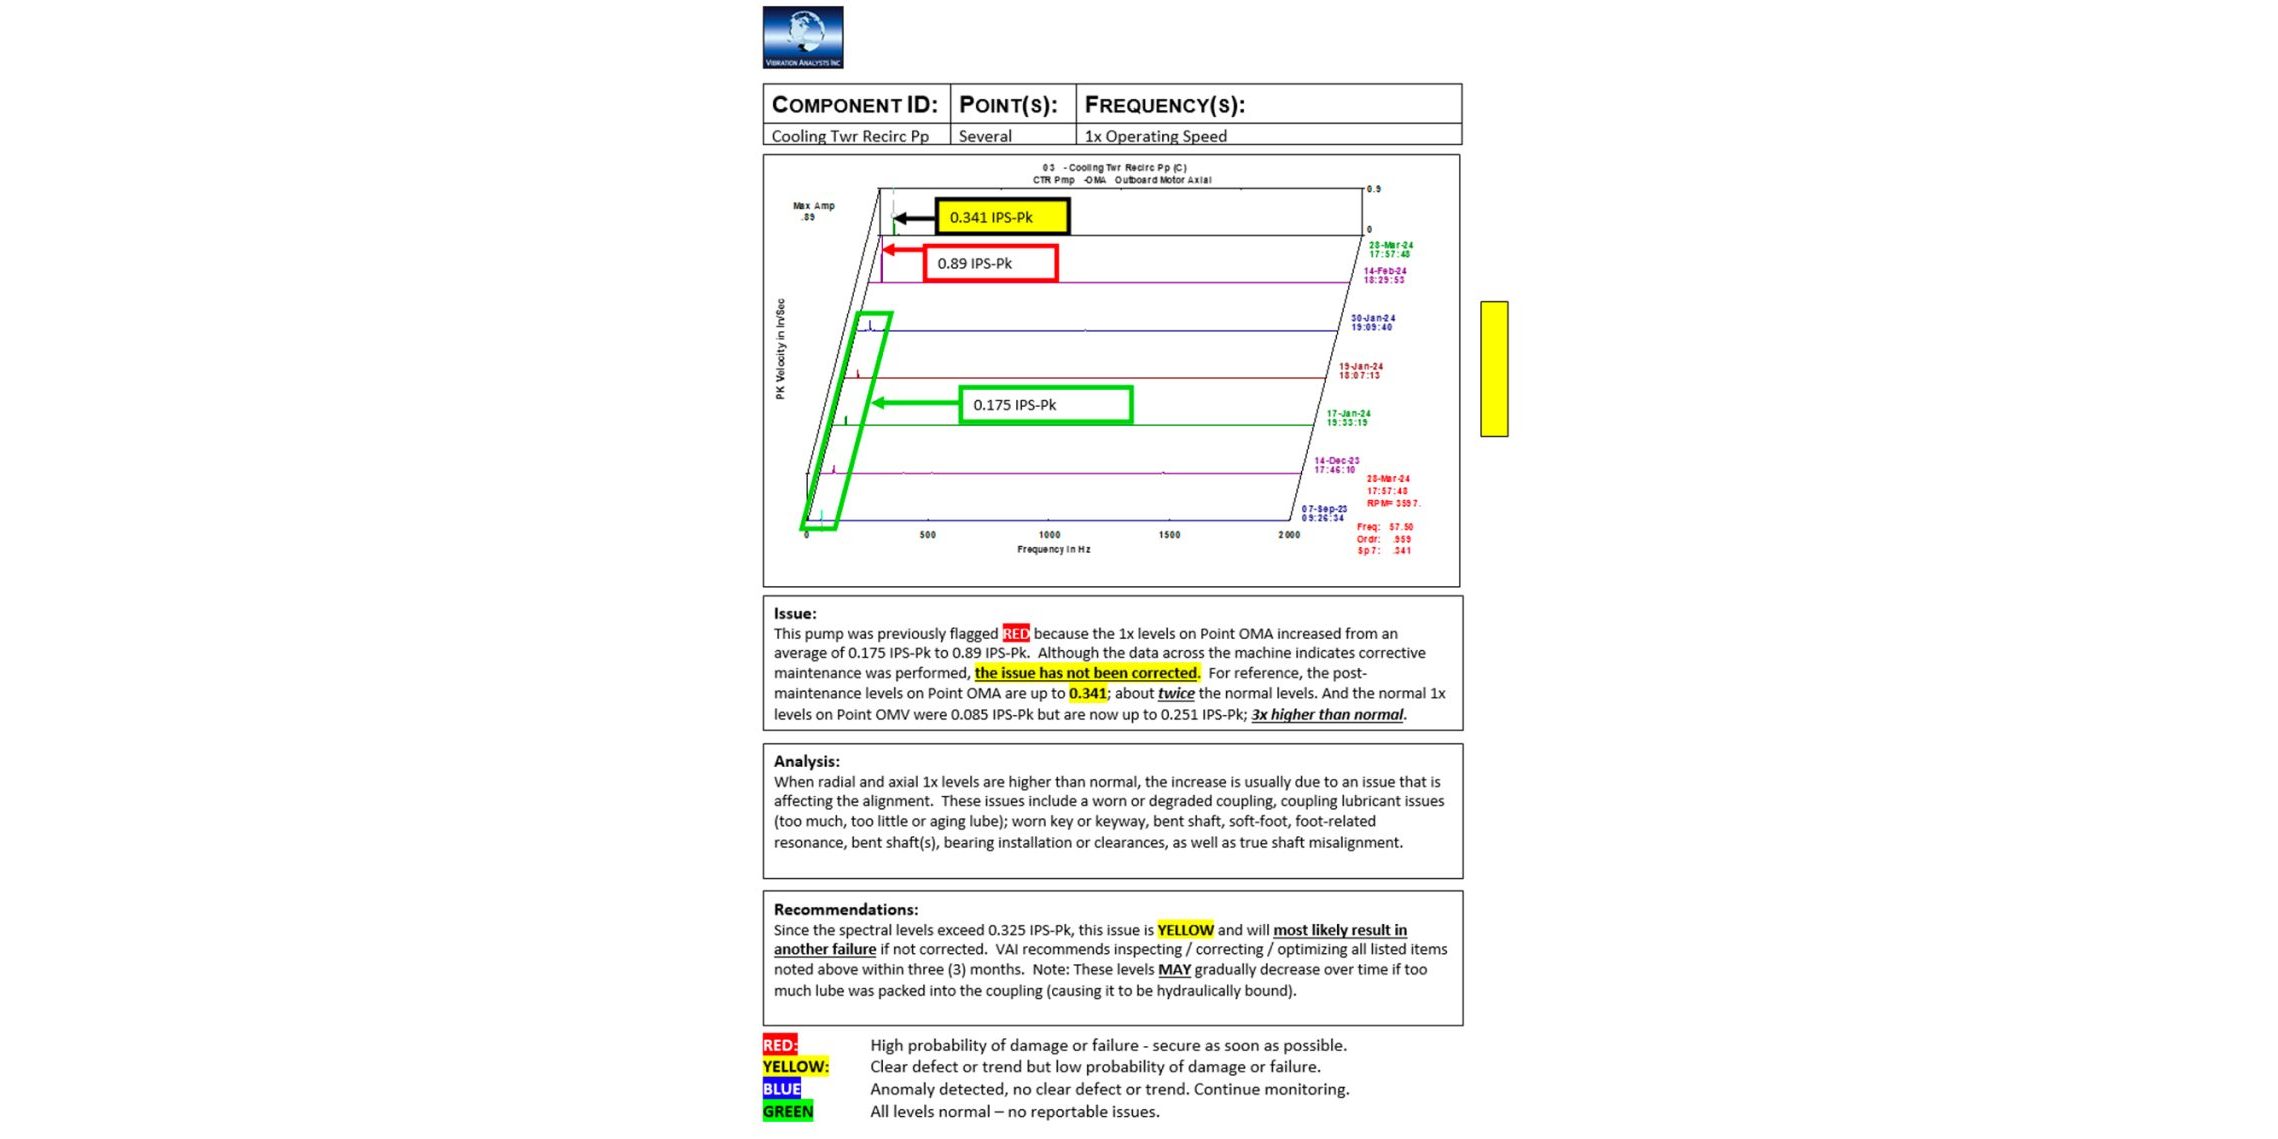
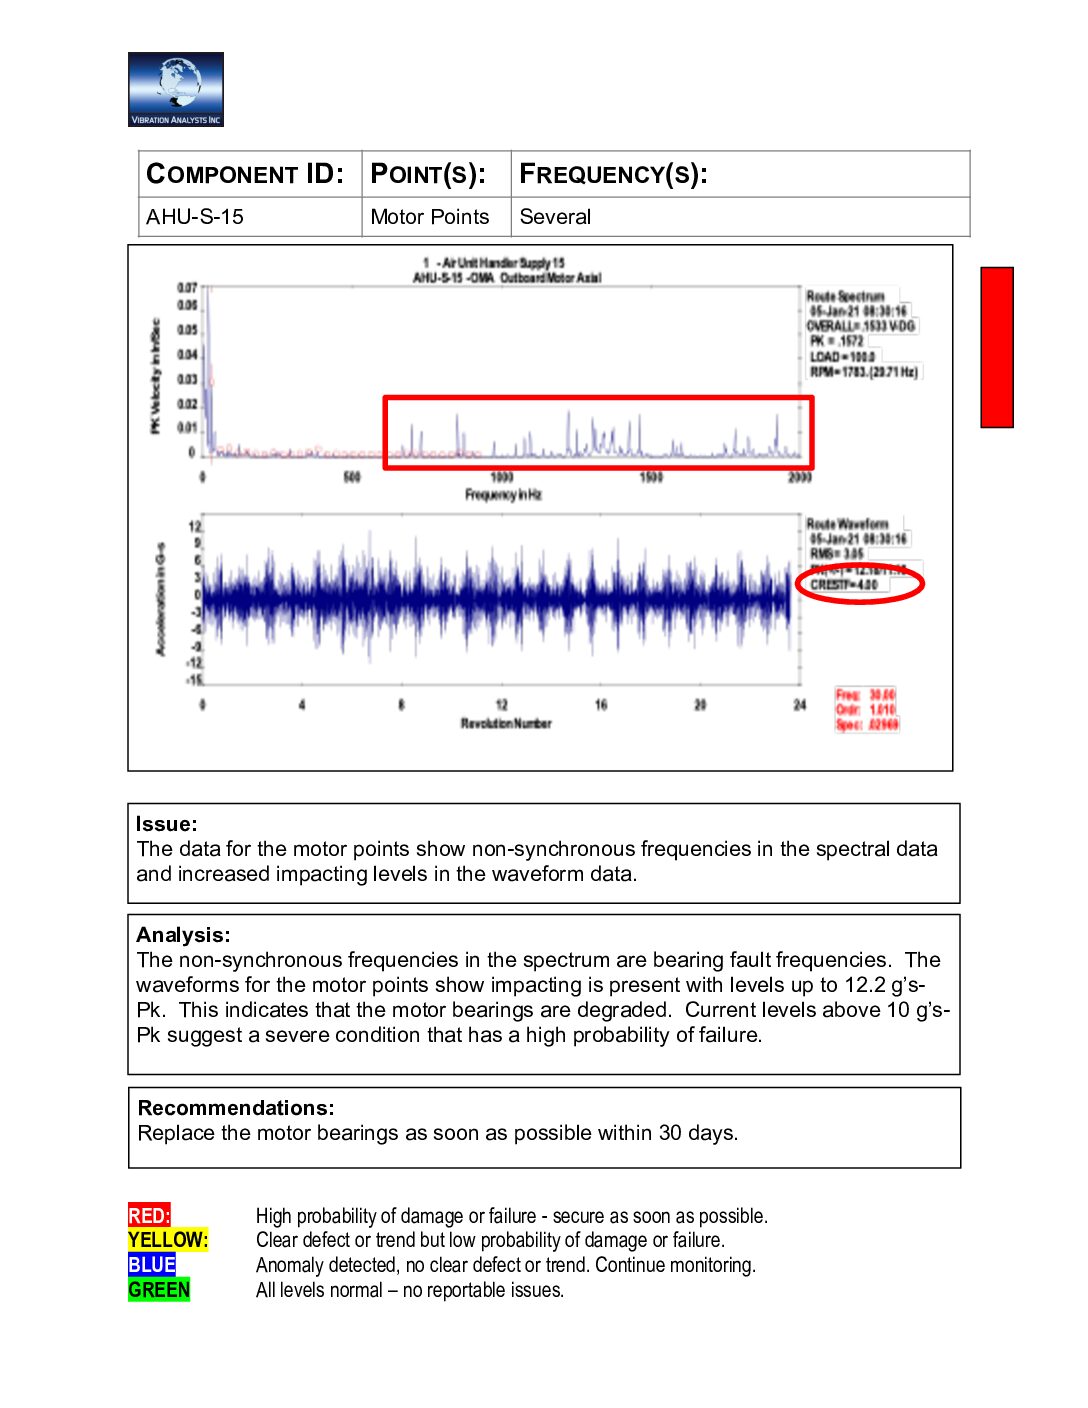
Component Pages
The final pages of a typical report provide the details used to arrive at our conclusions.
These detailed reports are generated for each component we monitor and analyze.
Graphs showing the vibrations we detected offer insight into the levels of vibrational variations we are currently seeing in a specific time period.
And again, we provide our analysis and recommendations on each component or machine.
As you can see, having this detailed level of reporting about the components in, for example, the High Roller Ferris wheel in Las Vegas or the pumps in a nuclear power plant like the Palo Verde Generating Station allows repairs and maintenance to be done on a time frame that provides the most convenience to the company and the least downtime. Multiple components can be repaired or replaced before they fail and all at the same time. Instead of waiting and repairing components, item by item, as they fail.
It’s a simple and cost-effective way to utilize the powers of predictive maintenance. Vibration analysis allows you to see into the future using real-time and highly detailed data about the operation of your machinery.


